with GTM effectiveness that leverage technology and the institutional knowledge of
Sales, Channel Partners & Customers

Built for Business Professionals
User experience designed for the Business Professional.
Dashboard to get answers to address key business challenges to derive detailed insights into the data via Charts/Tables / Key Highlights / Notes and other features.

Superior Text Classification
Derive Actionable Insights from textual feedback by taking into account the Meaning of the sentence / Ordering of the Sentence / Context of Sentence.
AI and Deep Learning Technology that through constant training / learning / updating improves the prediction outcomes.

Enriched Analytical Dashboard
Integrate Qualitative and Quantitative Feedback Analysis into one unified view with actionable insights.
Cross tab / combining / comparing data from multiple data sources via AI Dashboard.
Garner Insights
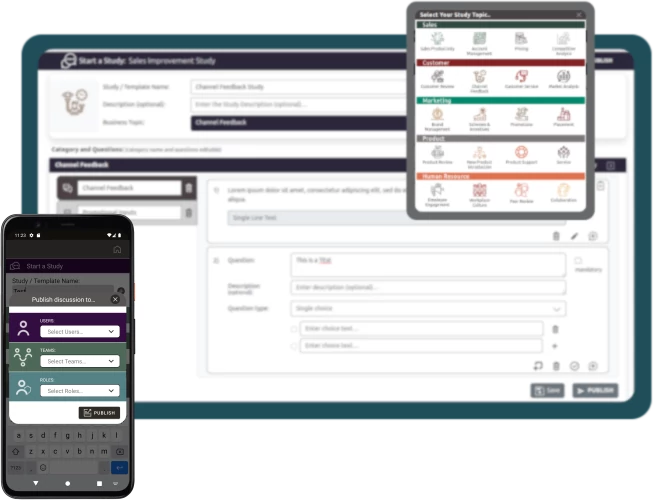
Get continuous Insights from those closest to the business issue to make quick educated decisions on sales issues, competitors, buyers, and more
- Easy to setup questionnaires with multiple question option types
- Predefined templates to address key issues in areas related to Sales, Product, Marketing and Customer
- Setup groups / Teams and other profile criteria for quick notification of the input request to the participants of Study
- Short Studies with continuous loop to engage participants to provide quick responses to address immediate burning issues
Collaboration
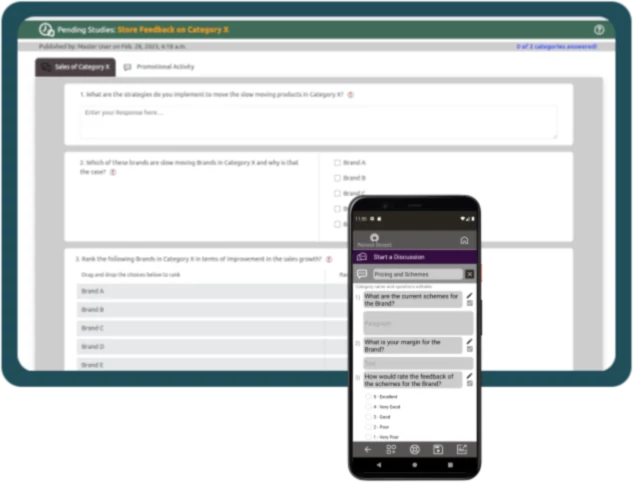
Enables for brainstorming, idea generation and trouble-shooting on key issues with your key stakeholders / participants of Study
- Easy to setup questionnaires with multiple question option types
- Participants can access the TriestAI via the Android & iOS App or the Web
- Easy to use UI to share inputs
- Quick Notifications to the participants via email or the App to inform them of the Study and its important to the business
- Real-time status updates and tracking of progress to ensure for quicker response rates
Analysis
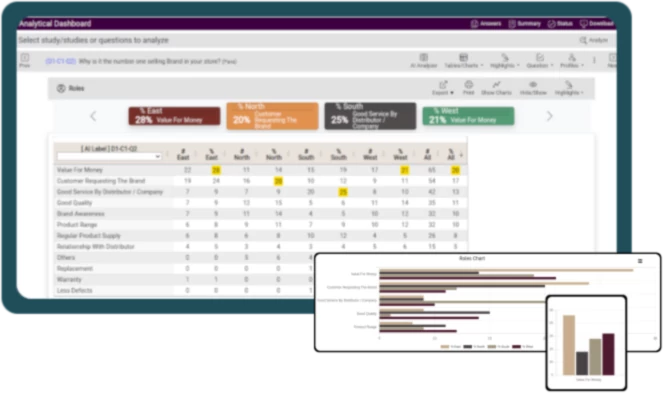
AI powered Analytics using Large Language Models provides richer and deeper understand of the inputs provided by the participants
- Glean key insights from the Qualitative (Textual) & Quantitative inputs enables the decision makers to get a complete 360 degree view of the situation
- Analytical dashboard built with easy to use analytical controls to do data cuts / cross tabs taking into multiple parameters
- Ability to compare and combine information from multiple sources with a few clicks
Dashboard / Reporting
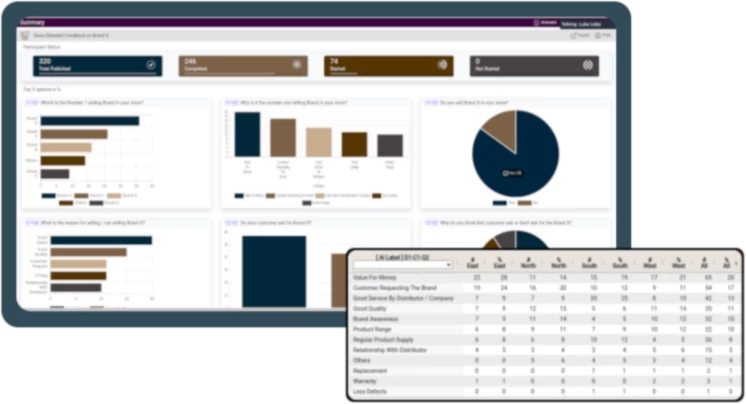
Rich reporting and visualization tools provided users the ability to quickly grasp the key findings and actionable points uncovered through the Analytical process
- Dashboard built for the business professional with charts / key highlights / flags / notes etc. to the relevant analysis
- Snapshot / Summarization of the Key Findings tailored to streamline the decision making process for the Business Executives
- Report download available in multiple formats – excel, csv, pdf with the detailed analysis and supporting data
